White Paper
Analog Reliability Analysis for Mission-Critical Applications
Rapidly increasing electrical content in automobiles is driving the need for revolution in analog integrated circuit (IC) design methodology. Compared to designing for consumer electronics, designing for mission-critical applications—industrial, medical, space, and automotive—requires a different approach to reliability analysis. We will explore how reliability analysis needs to change for mission-critical design. These changes include better modeling of device degradation, accelerating electrical aging with additional phenomena that contribute to shifts in device characteristics, and using realistic use models to better represent the how the devices are used.
Overview
Introduction
One of the key challenges for mission-critical design is the need to reduce the failure rate across the product lifetime. Traditionally, the failure rate has been expressed as the bathtub curve.
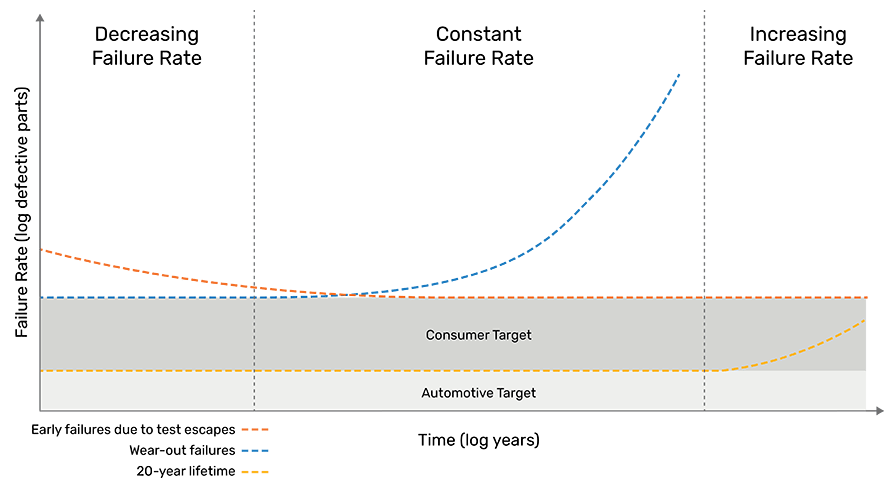
The bathtub curve has three regions: early life, useful operating lifetime, and end of life. It describes the general types of failures that occur after these devices reach consumers. Early failures are primarily due to test escapes (defective devices that are not identified during test).
During the useful operating lifetime, the challenge of the source of failures is to ensure that the device is constrained to operate within the operating range used for reliability analysis. Thermal over-stress is a particular concern. At the end of life, failures occur due to devices device wear out; in other words, changes of device characteristics are due to electrical stress.
While engineers may think in terms of the bathtub curve, customers—automotive customers in particular—have a different point of view. They want the failure rate for an IC to start out low: ideally, zero defective parts per million (dppm) and stay at zero dppm until beyond the useful lifetime of the product.
Consider the effect of a 1dppm failure rate for integrated circuits on an automobile. If a typical mid-class car has 80 electronic control units (ECUs), and each ECU contains several ICs, then for every million cars produced, about 1.5%—that is, 15,000 cars—will have defective components [1].
Design for automotive applications also place high expectations on reliability over the lifetime of ICs, as compared to the traditional requirements of consumer applications. Typical operating lifetimes for consumer products are from one to three years, while automotive applications require up to 15 years of lifetime [2].
In this paper, we explore how reliability analysis is evolving to meet the requirements of mission-critical applications, such as automotive design. First, we explore how designers currently perform reliability analysis, and then consider how the needs of mission-critical design is forcing the methodology to change. Finally, we consider some opportunities to enhance reliability analysis. We close with considering the impact of these enhancements on simulating the effect of radiation on circuit performance.
Reliability Analysis Then and Now
Designers have long recognized the need to analyze the reliability of ICs. Two commonly used approaches for performing reliability analysis include calculating the change in device degradation and relying on safe operating checks in circuit simulators.
The first approach is to calculate the change in device characteristics and device degradation, based on the electrical operating conditions and the temperature. The results allow designers to determine whether a circuit still meets specification at the end of life. One early tool for analyzing device degradation was the Berkeley Reliability Tools (BERT) [3]. This technology is available in the Cadence Virtuoso RelXpert Reliability Simulator. The Virtuoso RelXpert Reliability Simulator also introduced the innovative AgeMOS model. The AgeMOS model is a compact model for modeling device degradation due to hot carrier injection (HCI) and bias temperature instability (BTI). The AgeMOS model is used with the standard compact model to enable Virtuoso RelXpert Reliability Simulation. While the Virtuoso RelXpert Reliability Simulator is powerful, it requires special models to predict device aging; for example, AgeMOS and additional simulation runs.
To address these concerns, a second methodology for analyzing reliability has been developed. It relies on the availability of safe operating checks in modern circuit simulators. This technology is used in the Cadence Spectre Accelerated Parallel Simulator (APS). A safe operating check monitors a device during circuit simulation and issues a warning when the device leaves the safe operating region. Originally, safe operating checks were developed to assure that device junctions did not exceed their breakdown voltage. However, by defining an acceptable change in device characteristics, the safe operating checks can be used to perform reliability checks. This approach is sufficient for consumer applications in which product lifetimes are relatively short. The advantage of using safe operating area checks is that they are performed while the design is being simulated, so for no extra effort, designers can verify the electrical performance of their design and assure that it will meet their reliability criteria. The limitation of using safe operating area checking is useful but does not provide insight into the performance at the end of life. Due to its ease of use, the safe operating region-based approach to reliability analysis has become widely used.
The approach we focus on is reliability analysis, where we go back to device degradation calculations and look at how we can improve the results. Specifically, we focus on three areas: improving the device degradation model, improving the analysis by accounting for factors that accelerate device aging, and introducing the concept of mission profiles.
Modeling Device Degradation
The first improvement to reliability analysis is to improve the model used to calculate the device degradation. The original lucky electron model (LEM) [6] was first developed to describe device degradation. The AgeMOS model is a more advanced version of the LEM model that is predictive for planar CMOS transistors down to 28nm. Recently, other model formulations have been proposed, including electron-electron scattering (EES) [7], and multiple vibrational excitation (MVE) [8]. These models offer improvements over the LEM approach but are not sufficient now to support the new device structures required for advanced-node designs; that is, for designs with FinFET transistors.
The three-dimensional (3D) structure of a FinFET transistor results in changes in how stresses affect device degradation. So, a new aging model for FinFETs has been developed and demonstrated [9]. This model has been enhanced to provide better prediction of HCI-induced degradation, including saturation effects under high-stress conditions. In addition, modeling of BTI-induced degradation and recovery has been improved. This model is extensible, allowing for unified aging for both legacy and advanced-node reliability analysis.
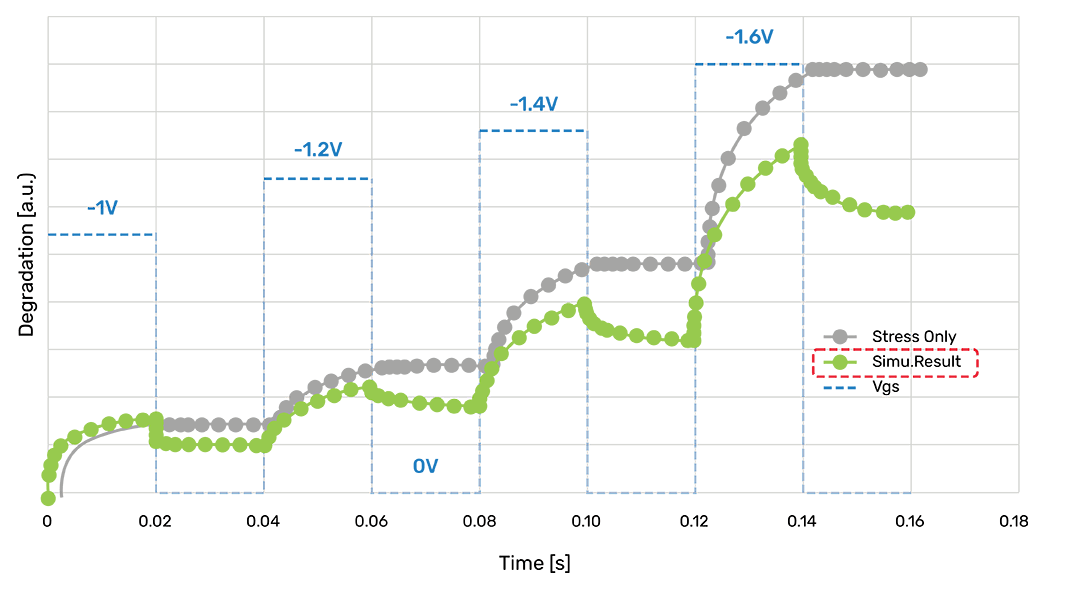
Figure 2 shows simulation results for bias temperature recovery using the new generation reliability model. The new recovery provides better prediction of degradation and recovery across operating conditions, like varying overdrive and recovery levels and duty cycle.
Accelerating Reliability Analysis
Next, we will look at how the calculation of device degradation can be improved. In the existing reliability analysis flow, device degradation due to electrical stress is simulated. For reliability simulation, other factors contribute to device degradation; temperature or process variation are considered globally, so all devices are treated equally with respect to temperature and process variation.
Instead of decoupling these phenomena, we will look at accelerating device degradation by considering the interaction between electrical stress, temperature, and process variation.
Electrical stress
In the Virtuoso RelXpert Reliability Simulator, the effect of the electrical stress on device degradation is calculated. The applied bias results in device degradation due to HCI and BTI.
Temperature
The effect of temperature also needs to be included in the analysis. Temperature is treated as a global parameter; typically, the ambient temperature is used. Because device degradation is exponentially dependent on temperature, small differences in temperature can result in significant differences in device degradation. Accounting for the variations between different devices becomes important for advanced-node transistors since their 3D structure results in significant self-heating.
Consider two devices with identical layouts. If one device drives a large load with a high activity rate (for example, a fast clock), and the other drives a light load node and at a low activity rate (for example, only active during power-on reset), the two devices age at different rates because their temperatures are different. To simulate the effect of self-heating on device degradation, the reliability simulation is modified [10]. First, a self-heating analysis is performed to calculate the average temperature of each transistor. After back-annotating each device with its temperature, the reliability analysis is performed, including the effect of temperature and electrical stress. At the cost of additional simulation time, the calculation of device degradation can be improved.
Process variation
In addition to temperature, the effect of process variation should be included in the analysis. We could perform reliability analysis across process corners similar to how we perform other standard PVT verification of a circuit. The limitations of this approach are that it provides no insight into the design margin and it does not include the interaction of device mismatch and device aging.
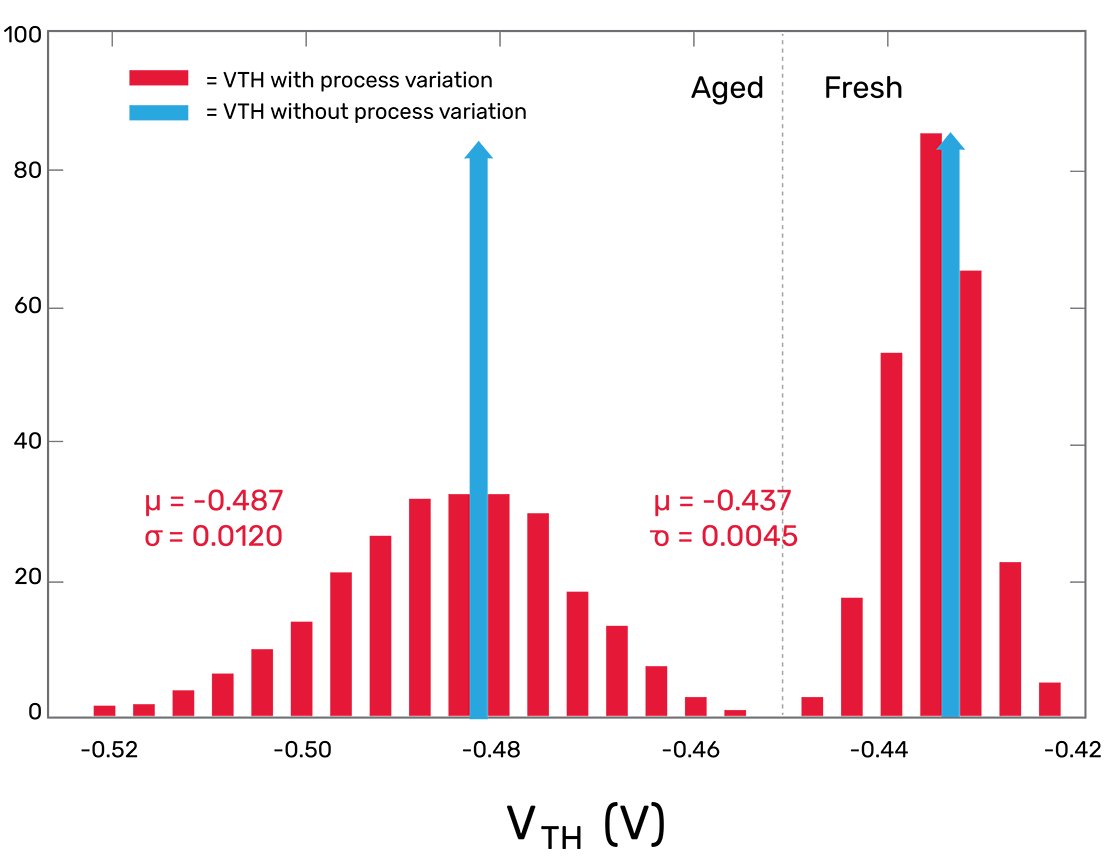
Another approach to account for the effect of process variation on device aging is to perform reliability analysis and then use the statistical variation from the fresh simulation. The fresh simulation is the simulation before aging analysis is performed and the results are used to estimate the Monte Carlo distribution at the end of life. This approach has limitations; for example, it ignores the relationship between process variation and device degradation. The next approach is to analyze the effect of process variation and device degradation together [11]. The process is to perform a Monte Carlo analysis, then perform aging analysis on each Monte Carlo analysis seed. The cost to this approach is an increase from N Monte Carlo runs, to N Monte Carlo runs + N Aging runs, or roughly doubling the simulation time.
Figure 3 shows an example of analyzing process variation and device degradation together. There is one other consideration: the device statistical models also need to be enhanced to account for correlation between process variation and device degradation. As with temperature, at the cost of increased simulation time we can significantly improve the accuracy of the simulation results. To improve the accuracy of reliability analysis, the analysis must account for the phenomena that contribute to device degradation: electrical stress, temperature, and process variation.
Mission Profiles
Another opportunity to improve reliability analysis is to improve the description of the device operation. One approach for describing the use model is to adopt the concept of a mission profile to describe device degradation. Mission profiles are a new concept that are still in development. In this section, we look at how they compare with the existing approach for describing the stress devices experience during operation.
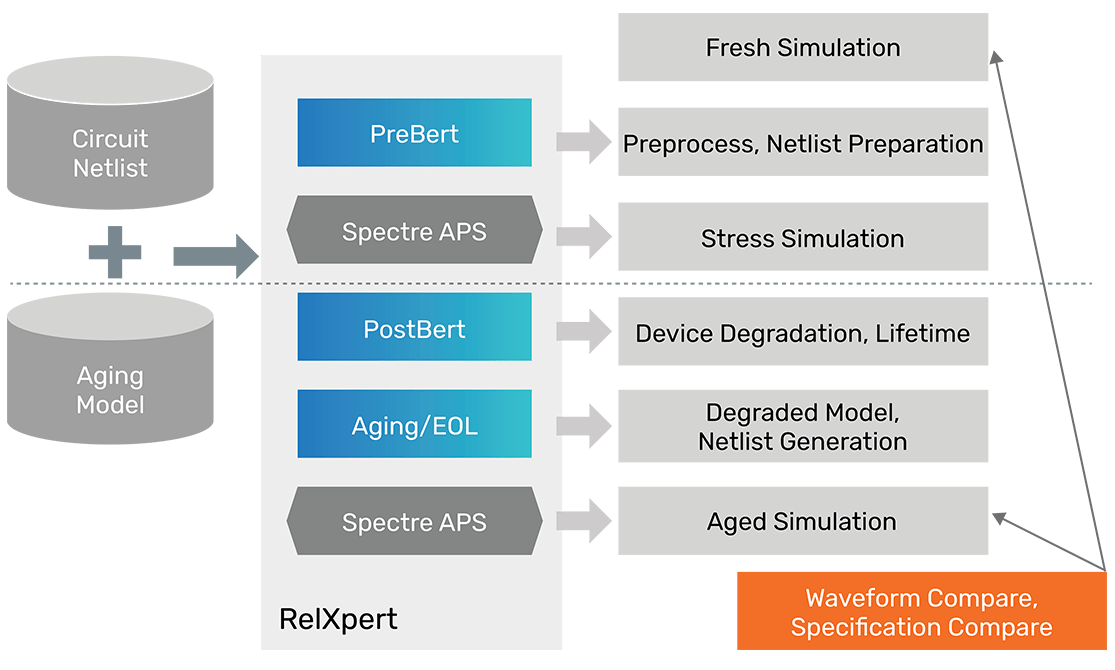
Consider the Virtuoso RelXpert Reliability Simulator simulation flow, shown in Figure 4. Typically, reliability analysis requires two simulations in addition to the fresh simulation.
-
 The first simulation performed is the stress simulation. The stress simulation is performed at the worst-case operating conditions. For example, if the fresh simulation is performed at the ambient room temperature, 27°C, and supply voltage is 3V, then the stress simulation’s temperature might be performed at the maximum temperature, 80°C, and the worst-case power supply voltage will be 3.3V. The intent is to calculate the maximum shift by using the harshest reasonable operating conditions.
 - The second simulation is the aged simulation performed with the same conditions as the fresh simulation. The aged simulation characterizes the shift in the design performance due to device degradation.
Unfortunately, just using the worst-case conditions results in excessive pessimism, particularly for applications like automotive design. While the environmental conditions that automobiles operate in can be harsh, automobiles do not operate continuously. Consider how many hours a day an automobile is used—the use is sporadic at best. Another consideration is the climate—the ambient temperature of an automobile experience in the Arctic Circle is generally quite different than an automobile experience in the hot desert. The result is that we need to change how we apply the stress. The stress simulation must account for the variable operating conditions.
The goal of a mission-critical profile is to represent an aggregation of the different conditions under which an automobile operates. In practice, this means that multiple stress simulations are performed, each with differing duration. For example, a complete stress simulation could include ten stress simulations at different temperatures from 0°C to 150°C, each simulation performed with a different duration.
The traditional approach to reliability analysis of using worst-case stress is overly pessimistic and results in overdesign. By creating a description of the stress that represents the actual use model, designers can avoid this problem.
Tools for Reliability Analysis
Two existing tools for reliability analysis are the Virtuoso RelXpert Reliability Simulator and Spectre Native Reliability Analysis. These tools complement each other. The Virtuoso RelXpert Reliability Simulator is a flexible design tool for reliability analysis, and Spectre Native Reliability Analysis is the high-performance capacity tool for verification including reliability analysis. The advanced tools for reliability analysis are available in the Cadence Legato Reliability Solution.
Conclusion
In this paper, we have looked at some new approaches to performing reliability analysis. These new approaches include better modeling of device degradation and a more holistic approach for calculating device degradation. The device degradation analysis can be improved by considering all the phenomena that result in device degradation. The other approach to improving reliability is to better describe how the device will be used, which better models the stress the device experiences. Reliability analysis for mission-critical applications is driving the need to provide better prediction of product lifetime provided by the Legato Reliability Solution.
References
- Infineon, “Living Automotive Excellence: On the way to Zero Defect products and services,” 2008.
- Bosch, “Design Requirements for Automotive Reliability,” 08 Jul 2006.
- R. H. Tu et al., “Berkeley reliability tools-BERT,” IEEE Transactions on Computer-Aided Design of Integrated Circuits and Systems, vol. 12, no. 10, pp. 1524-1534, Oct 1993.
- JEDEC, “Methods for Calculating Failure Rates in Units of FITS, JESD85,” Jan 2014.
- P. Ellerman, “Calculating Reliability Using FIT & MTTF: Arrhenius HTOL Model,” Jan 2012.
- S. Tam, P.-K. Ko, and C. Hu, “Lucky-electron model of channel hot-electron injection in MOSFETs,” IEEE Transactions on Electron Devices, vol. 31, no. 9, pp. 1116-1125, Sep 1984.
- M. Bina, S. Tyaginov, J. Franco, K. Rupp, Y. Wimmer, D. Osintsev, B. Kaczer, and T. Grasser, “Predictive Hot-Carrier Modeling of n-Channel MOSFETs,” IEEE Transactions on Electron Devices, vol. 61, no. 9, pp. 3103-3110, Sep 2014.
- C. Guerin, V. Huard and A. Bravaix, “The Energy-Driven Hot Carrier Degradation Modes of nMOSFETs”. IEEE Transactions on Device and Materials Reliability, pp. 225-235, Jun 2007.
- S. Liao, C. Huang, and A. C. J. X. T. Guo, “New Generation Reliability Model,” Dec 2016.
- J.-G. A. Alvin Chen, P. Y. Annie Liu, and P. Chen, “Reliability and Self-Heating Simulation Methodology for TSMC 16FF+,” April 2015.
- A. Zhang, C. Huang, T. Guo, A. Chen, S. Guo, R. Wang, R. Huang, and J. Xie, “Reliability variability simulation methodology for IC design: An EDA perspective,” Washington, DC, 2016, pp. 11.5.1-11.5.4.