White Paper
Accelerating Statistical Variation Analysis and Parametric Circuit Yield Verification
Spectre StatAI
Over the years, semiconductor process nodes have been scaled aggressively, with device dimensions now approaching below 5nm. This, along with lower device operating voltages and currents, has allowed modern integrated circuits (ICs) and system-on-chip (SoC) designs to incorporate more devices in a smaller chip area without compromising on lower power consumption and optimal performance. However, a consequence of aggressive process scaling combined with high-volume manufacturing (HVM) is that ensuring a very low probability of failed ICs has become extremely difficult.
Process, voltage, and temperature (PVT) corner simulations and statistical variations on corners with Monte Carlo (MC) simulations have been widely adopted by the IC design industry for a long time. These methods allow designers to incorporate maximum variability using semiconductor foundry-provided models in the early stages of IC design. The results could be pessimistic or optimistic based on how aggressive the variation is considered to ensure a lower probability of an IC failure. For MC simulations with global process and local mismatch parameter random variations, considering very large sample spaces crossing a billion samples are becoming an integral part of parametric circuit yield verification methodologies targeting HVM. As the number of devices increases in a circuit, the number of statistical random variables also increases. Easily crossing 100,000 variables in modern IC designs and performing MC simulations along with corners with the expectation of finding a failure from a billion samples is extremely expensive computationally. As a result, EDA solutions using state-of-the-art simulator technologies handling any circuit and technologies that enable fast (minimum number of simulations) and accurate low-sigma/high-sigma analysis are essential, and Spectre StatAI Analysis is Cadence’s AI-enhanced, production-ready solution.
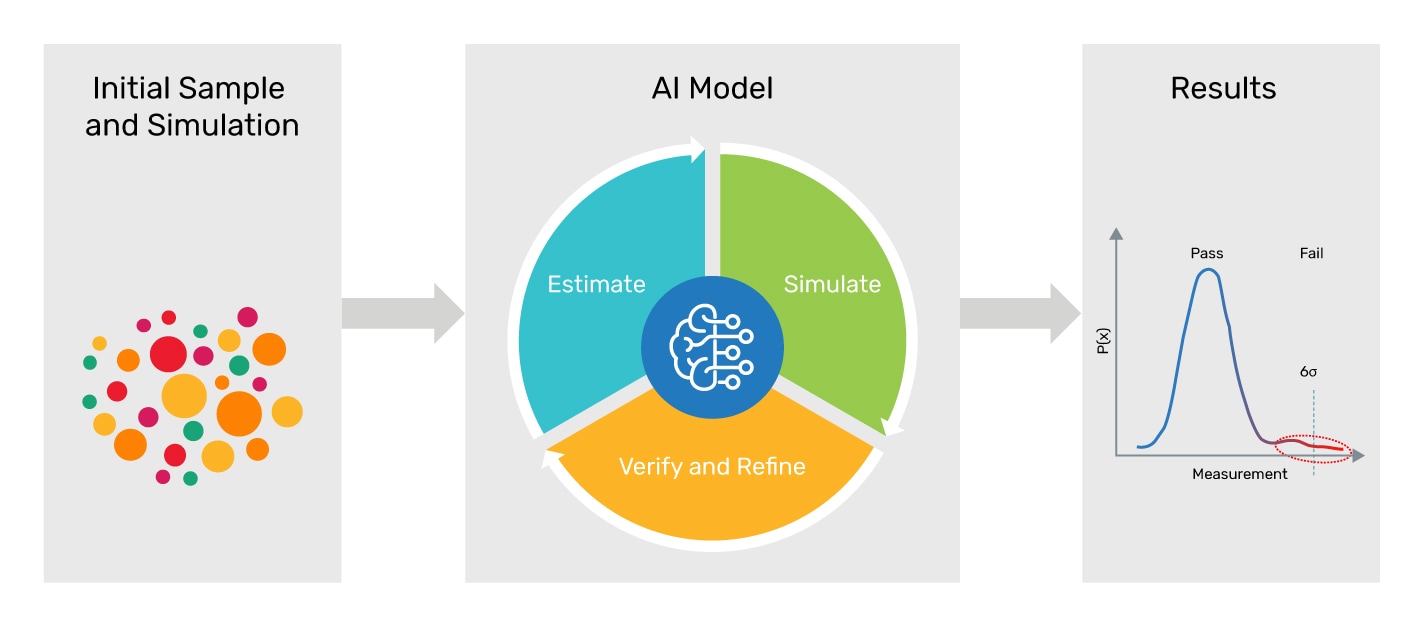
Spectre StatAI Analysis is the AI-enhanced technology integrated into the well-known Spectre Simulation Platform, leveraging the capability to perform statistical variation analysis on any circuit by appropriate choice of a Spectre simulator (Spectre X, Spectre FX, Spectre RF, Spectre AMS). Spectre StatAI Analysis provides three technologies, namely the worst samples, yield estimation, and smart corners methods, to suffice any kind of low-sigma, high-sigma, and parametric circuit yield debugging and verification. In this paper, we demonstrate only the Spectre StatAI Analysis worst samples estimation method, using multiple case studies covering different types of circuits. The case studies involve high-sigma analysis applications on memory bit-cells, flip-flops, and analog IP in advanced-process nodes that are more representative of the analysis problems encountered in modern chip designs today.
Overview
Introduction
Modern SoCs today have diverse building blocks, ranging from memories to standard cells (such as flip-flops, multiplexers, and I/O cells) and analog blocks (including PLLs, ADCs, power management blocks, and RF components). Incorporating variability as a design factor in nanometer technologies is critical in the early stages of such complex SoC designs at the chip level and also at the block level. This is because random process variations can lead to a large variation in the basic functionality of the smallest building blocks, such as SRAM bit-cells or flip-flops in modern designs.
These variations lead to a higher probability of IC failures in large-volume production, resulting in poor yield and performance. For example, random dopant fluctuations (RDF), line edge roughness (LER), and variations in gate oxide thickness are a few of the well-known sources of variations that affect SRAM bit-cell characteristics. The large sensitivity of SRAM bit-cell characteristics (read or write operation) to these random process variations can lead to a whole memory block failing, which in turn can cause an SoC operational failure. Such failures can also occur from other sensitive blocks like ADCs, DACs, PLLs, or even power management circuit blocks, although they might not be in high densities as compared to memories and flip-flops.
Over the years, process design kits (PDKs) provided by foundries have been able to capture local and global transistor device-level physical process parameter variations as sufficiently accurate statistical models. These statistical models are then used across the Spectre Simulation Platform to perform statistical simulations and estimate the probability of a design failure.
With semiconductor technology node advancements, a higher component multiplicity is expected while integrating more transistors in a smaller area. However, there is no benefit from higher density integration without ensuring a good manufacturing yield. For example, with the increase in the number of memory and logic design blocks, even a very small probability of failure—such as one failure in a billion, often referred to as six-sigma yield—would have a significant impact on yield. For estimating the yield, an IC designer must either run a billion or more MC samples, which is computationally expensive and, to a large extent, impractical, or adopt alternative strategies.
Even for blocks with a low component multiplicity expected in a chip, the number of Monte Carlo simulations needed to lower the uncertainty of a failure from even 5000 samples is expensive due to the large simulation time of the block itself. Therefore, a faster Monte Carlo analysis-based solution is required for low-sigma and high-sigma analysis to ensure lower uncertainty of an IC failure before meeting tapeout activities, mass production deadlines, and quick time-to-market schedules.
Accelerating Monte Carlo Simulations
Let us consider SRAM blocks as an example, as they are some of the most common blocks in today’s SoCs for a wide variety of memory applications. In SRAM designs, memory bit-cells are arranged in a row-column fashion in large densities along with sense amplifier blocks to achieve high-density memory blocks. These types of memory designs, along with dense digital logic paths containing large numbers of flip-flops, are more sensitive to advanced node process variations. The sensitivity to these variations is such that even with a very low probability of a functional failure occurring, it can still lead to poor yield and performance as these circuits are used in modern chip design in large densities. Finding this small probability of failure in a large sample space is important to ensure high yield and performance. As an example, for SRAMs, the possible bit-cell failure characteristics that are well-studied and analyzed by design experts include the following:
-
 Failure during a read-access operation
 - Failure due to read operation stability
- Write operation failure
- Data retention failure
The term sigma defines the required yield value in an easily interpretable manner. One failure in a billion, or a yield value corresponding to 99.99999980%, represents a six-sigma yield. Today, for SRAM designs targeted to advanced-process nodes to achieve a high yield, the bit-cell failure probability must be very low—in the range of 10-6 to 10-12, that is, 4.5σ to 6.5σ. Effectively, this means that to characterize at high sigma, simulations between one million and a billion would be required to simulate the entire distribution and find the worst-case measurement results in the tails of the distribution. Figure 1 shows an example of such a histogram distribution from 1 million MC simulations.

Figure 1 shows the distribution for a measurement from the memory bit-cell checking the write operation stability or write margin. This measurement measures a memory bit-cell flip time from world line (WL) rising 50% to a bit-cell internal node, which is rising to 70%. A write failure may also happen if the WL pulse is not long enough for the bit-cell to flip the internal nodes. The write margin decreases as sigma increases, which is the worst-case for a write operation. Figure 1 also shows the typical non-Gaussian bell curve, which is seen based on the type of design and advanced technology node used and the nature of how the total number of statistical variables varies in a high dimensional design space. The minimum and maximum tail points, along with the non-normal behavior of the distribution, can be seen more clearly using normal quantile plots, as shown in Figure 2.

Performing more than one million simulations to find the high-sigma tails in a design with a large number of standard cells or memory bit-cells, or even in digital timing critical paths, is not a productive approach, even with the latest performance improvements available in the Spectre X Simulator and distributed processing. As an alternative, Spectre StatAI Analysis integrated into the Spectre Simulation Platform can be used to accurately identify the high-sigma worst-case tail values of interest with the minimum number of simulations. The next section covers this in detail, with case studies following.
Spectre StatAI Analysis for Worst Samples Estimation
There are several methods and point tools available for estimating high-sigma tails from a high-dimensional design space involving many statistical process variables. Each method and tool has advantages, disadvantages, and applicability to specific applications. In this paper, we give an overview of the sample reordering technique along with the ML technology that has been integrated into the Spectre Simulation Platform.
Figure 3 shows a very high-level abstraction of what is inside Spectre StatAI Analysis for fast worst samples estimation. Spectre StatAI Analysis is built on top of the industry-proven Spectre MC engine. The worst samples estimation method in Spectre StatAI Analysis is driven by the following parameters:
- The sample space of interest
- The sigma of interest
- The circuit measurement-based goals that define the criteria for pass and fail of the circuit functionality
Based on the above parameters, Spectre StatAI Analysis starts in the following manner:
- A few random MC simulations are performed to build a mathematical response surface model (RSM) of the output as a function of inputs using an ML kernel in the Spectre environment. This RSM model is used for initial predictions of the entire sample space of interest.
- Using the model predictions, a sample reordering is performed, which orders the MC samples from worst to best using model predictions of the measurement values specified as goals.
- Model quality checks occur by simulating a certain number of the predicted worst iterations.
- Upon simulating predicted worst iterations, an estimate of predictive model error, as well as the quality of sample reordering, is obtained. This information is used to update the earlier built RSM, followed by again predicting the values for the entire sample space of interest.
- Multiple intelligent mechanisms drive the stopping conditions in Spectre StatAI Analysis for worst samples estimation and are kept as a trade secret.
- The end result summarizes the worst samples for the measurement-specific goal in the form of a sigma, the exact MC iteration number, and value, allowing further debugging.
ML-based active training, learning, prediction, sample reordering, and model refinement are continuously occurring in an iterative manner until certain desired stopping conditions are met. The target value specified by the user for measurement goals is utilized to label a simulated value as a pass or fail. For example, goal delay max 10ps , would indicate that during the predictions any evaluated delay measurement exceeding 10ps is a functionality failure and influences the estimation of the worst tail samples from the distribution corresponding to this goal.
Distributed processing is leveraged in the technology to enable vast sample space scanning, model evaluations, and simulations to occur concurrently for achieving faster turnaround times and compatibility with compute farm and cloud computing environments.
Worst Samples Estimation Case Studies
The following case studies show the effectiveness of the Spectre StatAI Analysis worst samples estimation method.
Bit-Cell and SRAM IP Design
A bit-cell array design using statistical design models from a sub-10nm PDK was tested using the traditional MC simulation flow with the Spectre X Simulator and Spectre StatAI Analysis. The goal was to identify the measurement values close to 4.5σ from a sample space of 1 million MC samples. Using the Spectre X Simulator on this bit-cell array with a circuit inventory of 8,000 transistors and <1,000 statistical parameters, 1 million brute-force MC simulations were done to find the minimum and maximum worst-case values of the measurement.
Using Spectre StatAI Analysis, we were able to accurately identify the high-sigma min and max tail ends in less than five minutes with just 746 simulations. Figure 4 shows the correlation between brute-force MC and Spectre StatAI simulations in the form of a probability plot. This probability plot depicts the 1 million simulated MC samples with blue dots, where each dot is the measurement value obtained from MC simulations. The red circles depict the high-sigma values identified by Spectre StatAI Analysis, which overlap with the MC simulated values and hence are accurate with a speedup of 1340X. Also, note the non-linear nature of the measurement in Figure 4 captured by the probability plot. It is evident that the ML kernel in Spectre StatAI Analysis is taking care of such non-linearity as expected in circuit measurement distributions.
A discontinuous type of distribution also can be expected from circuit functionalities while operating in different modes or during the occurrence of failures. An example is shown in Figure 5a, where a measurement from another sub-7nm bit cell design with 100 statistical variables was tested with Spectre StatAI Analysis worst samples estimation method. The goal was to identify the possibility of core bit cell voltage dropping below 0.3V from a sample space of 1 million MC samples. With just 2500 simulations, Spectre StatAI Analysis was able to identify the worst samples from 4.0σ to 4.9σ accurately with a 400X speedup.

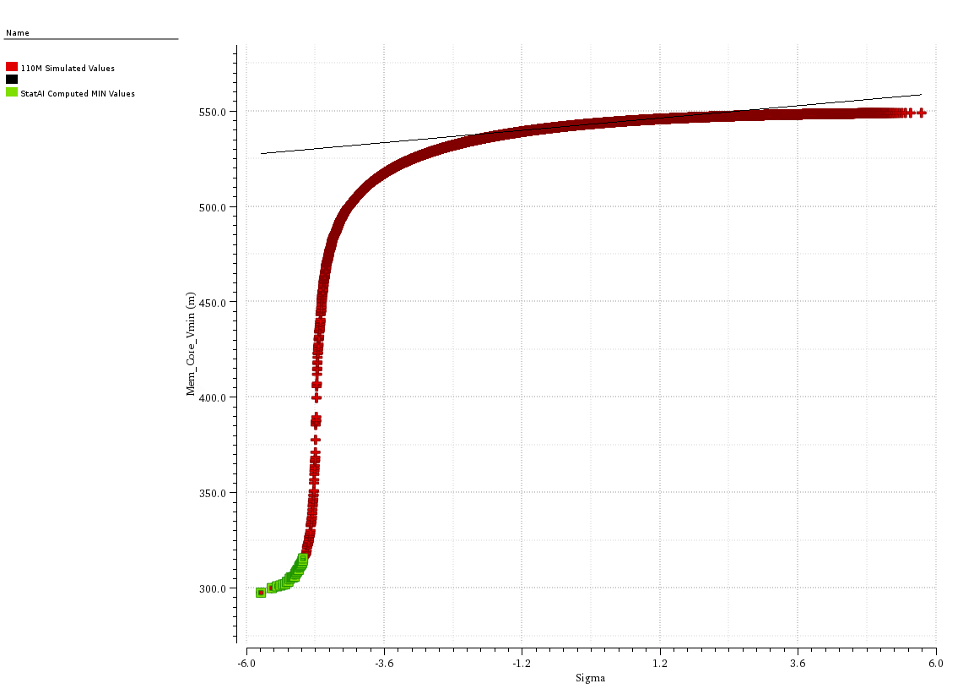
With bigger bit-cell arrays like a SRAM IP design itself, switching to Spectre FX simulator can be more effective for high-sigma analysis. An example is shown in Figure 5b, where a measurement from another sub-5nm SRAM IP design with around 6000 transistors and 40,000 statistical variables was tested with Spectre StatAI Analysis worst samples estimation method using Spectre FX as the simulator. The goal was to identify the possibility of SRAM voltage-dependent measurement dropping below 550mV from a sample space of 110 million MC samples. With just 4500 simulations, Spectre StatAI Analysis was able to identify the worst samples from 5.0σ to 5.74σ accurately with a 20,000X speedup. The choice of Spectre FX simulator helps in speeding up the individual simulation cost of the 4500 simulations from hours to a few minutes and is crucial in speeding up the high-sigma analysis.
From both of the examples using bit cells and SRAM IP, we see that:
- Spectre StatAI Analysis worst samples estimation method handles continuous and discontinuous type measurements.
- Spectre StatAI Analysis estimated tail samples are SPICE accurate when compared with brute-force MC results and are able to achieve a tremendous speedup, avoiding the need to do brute-force MC simulations.
- Spectre StatAI Analysis usage with Spectre FX can be very productive due to the combination of an industry-leading FastSpice simulator optimized for SRAMs and the AI-enhanced technology to handle many variables with any distribution type.

Flip-Flop Design
A multi-bit flip-flop design using statistical design models from a sub-5nm PDK was tested using the traditional MC simulation flow with the Spectre X Simulator and Spectre StatAI Analysis. The goal was to find the high-sigma worst-case values for a delay-based measurement close to 4.9σ from a sample space of 10 million MC samples.
Using the Spectre X Simulator, 10 million brute-force MC simulations were performed on the flip-flop design, which had 460 transistors and 3000 statistical parameters. From these MC simulations, the minimum and maximum worst-case values of the delay measurement were identified. With just 1,064 simulations in less than three minutes, Spectre StatAI Analysis was able to accurately identify the high-sigma min and max tail ends.
The reduction achieved with Spectre StatAI Analysis, in the actual number of simulations required to identify high-sigma tail ends, was 10,000X. The probability plot of this test, along with a zoomed view showing excellent correlation between the brute-force and Spectre StatAI values, is shown in Figure 6.

Timing Path
A critical-path SPICE netlist, created by the Cadence Tempus™ Timing Solution using statistical design models from a sub-14nm PDK, was tested using the traditional MC simulation flow with the Spectre X Simulator and Spectre StatAI Analysis. The goal was to find all the worst-case values between 3σ and 4σ with no more than 20,000 MC simulations. This extracted critical timing path netlist design had a circuit inventory of 4600 transistors and a total of 3665 statistical parameters. 20,000 brute-force simulations were done to sort the worst-case critical timing path values.
Next, Spectre StatAI Analysis was used on the same design, and with just 1,182 simulations, all the high-sigma values between 3σ and 4σ were accurately identified. The reduction achieved with Spectre StatAI Analysis, in the actual number of simulations required to identify high-sigma tail ends in this case, is 17X. The probability plot of this test is shown in Figure 7.


ADC Design
A 14nm FinFET-based analog-to-digital converter (ADC) design was tested using the traditional MC simulation flow with the Spectre X Simulator and Spectre StatAI Analysis. The goal was to find the high-sigma worst-case values for an input offset voltage measurement close to 3.9σ from a sample space of 10,000 MC samples.
Using the Spectre X Simulator, 10,000 brute-force MC simulations were performed on the ADC design, which had 5000 transistors, 4000 circuit nodes, and close to 45,000 statistical parameters. From these MC simulations, the minimum and maximum worst-case values of the input offset voltage measurement were identified. With just 900 simulations, Spectre StatAI Analysis was able to accurately identify the high-sigma min and max tail ends, as shown in Figure 8. The reduction achieved with Spectre StatAI Analysis, in the actual number of simulations required to identify high-sigma tail ends, was 10X.

Easy Debugging of a Failure and Moments
Since Spectre StatAI Analysis is built on Spectre MC analysis, the samples simulated in Spectre StatAI Analysis generate consistent results when simulated with the standard MC analysis. This simplifies the debugging process and allows standard Spectre MC analysis features to be used. For example, if Spectre StatAI Analysis identified the worst two samples as 1,201 and 99,999 for the design under test (DUT), the following MC analysis will repeat those specific samples or dump the actual process and mismatch parameters associated with these MC samples:
mc1 montecarlo seed=12345 runpoints=[ 1201 99999 ] … {
tr1 tran …
}
The biggest advantage is that you do not need to change the existing netlist-driven flows involving a large number of batch simulations using the Spectre Simulation Platform. With minimal netlist option additions, the existing netlists taken through traditional MC flows can be migrated to Spectre StatAI Analysis very easily for high-yield verification or finding high-sigma worst-case samples of interest.
The five moments describing the characteristics of the measurement distribution from the DUT can be estimated with Spectre StatAI Analysis. These include the mean, variance, standard deviation, skewness, and kurtosis information as a part of the Spectre StatAI Analysis worst samples estimation report.
Conclusion
In this paper, we have seen that the Spectre StatAI Analysis-based worst samples estimation method has the following advantages:
- It can be used for low-sigma and high-sigma verification on any kind of design ranging from bit-cells, SRAM blocks, standard cells, timing paths, analog, and RF blocks.
- It gives excellent SPICE accuracy compared to real brute-force MC simulations and, hence, is reliable for any kind of low-sigma and high-sigma verification and signoff applications.
- It gives excellent performance, ranging from 10X to more than 10,000X speedup, by avoiding the need to do brute-force MC simulations.
- It is very easy to debug a failure from the worst samples reported along with the MC iterations information.