Technical Brief
Simulating Reentry Trajectories into the Mars Atmosphere
This article is based on the vehicle reentry study conducted by Maximilian Maigler, a Ph.D. student at Universität der Bundeswehr München. He won the best paper presentation for his work on Predicting Reentry Trajectories into the Atmosphere of Mars at CadenceLive Europe 2022. To learn more about the numerical modeling, chemistry modeling, and simulations used in this study, watch the recorded video featuring Maximilian.
For more than half a century, nations across the globe have been sending astronauts into the vastness of space. Nevertheless, the successful landing of the spacecraft and the astronauts’ safe return remains one of the most significant concerns. To achieve this, engineers must design vehicles that can withstand the intense heat and pressure during re-entry. Also, it is essential to thoroughly study and understand the aerodynamics, deceleration, and trajectory dynamics involved in the re-entry process. Often, wind tunnel testing falls short in replicating the reentry conditions, and therefore, engineers resort to numerical methods and computer simulations to understand the physics behind reentry vehicles. In this article, comparing numerical methods for calculating lift and drag coefficients during reentry into the Mars atmosphere with experimental data from the Viking reentry capsule provides valuable insights into the accuracy and limitations of these numerical methods.
Overview
Motivation for Numerical Modeling of Re-Entry Vehicles
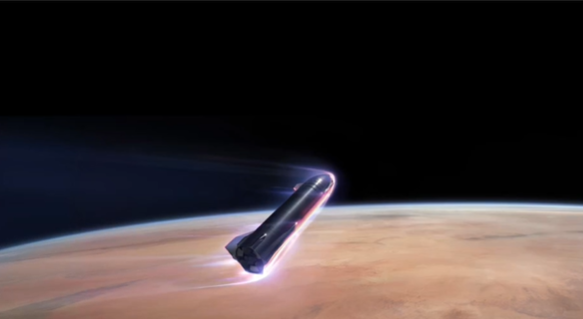
Reproducing the atmospheric conditions of Mars is a significant challenge, particularly in the rarified regime. Depending on the Knudsen number, the assumptions for continuum mechanics break down at high Mach numbers and low densities, and the molecular velocity and internal energy deviate from the equilibrium. Therefore, the re-entry velocity and temperature are difficult to replicate in wind tunnels, making it an expensive and challenging endeavor. However, flight data is available and can be used to validate computational approaches for predicting future missions. Moreover, advancing research in this area is crucial, given the non-axisymmetric reentry angle used by the Mars starship, which requires 3D modeling techniques rather than 2D axisymmetric approaches.
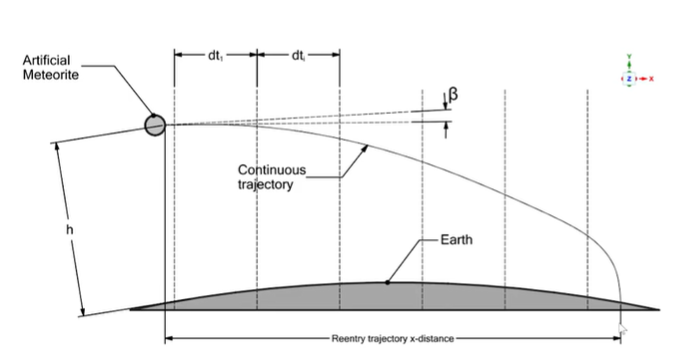
Predicting reentry trajectories requires splitting the continuous trajectory of a celestial body and discretizing it into real-time steps and coordinates. Different numerical methods are used for different regimes, and properties are updated for each real-time step. Here, computational fluid dynamics (CFD) or the direct simulation Monte Carlo (DSMC) method is used to estimate the lift and drag coefficient, moment coefficient, heat flux, and pressure. The results are then put into Newton’s equations. The velocity components in the X and Y directions are predicted based on forces derived from the lift-to-drag coefficients. Moreover, the vehicle's deceleration and altitude loss are predicted for each time step. This process is repeated until the entire trajectory is predicted.
Computation Methodology
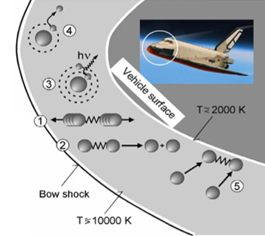
Simulating reentry trajectories has a few challenges. Continuum mechanics break down in the upper atmosphere, so traditional finite-volume methods can't be used. Additionally, reentry vehicles reach speeds as high as Mach 24, where shock waves induce such extreme temperatures that atmospheric molecules dissociate, requiring careful modeling so that all the key physics are captured.
Here, the computation methodology involves modeling the Boltzmann equation with three parts: external forces, diffusion forces, and collision forces. CFD methods can be used in the continuous regime if the Knudsen number is much smaller than 0.1. However, particle-based methods that approximate the diffusive part of the Boltzmann equation are necessary at high altitudes, and statistical Monte Carlo methods are used in this case.
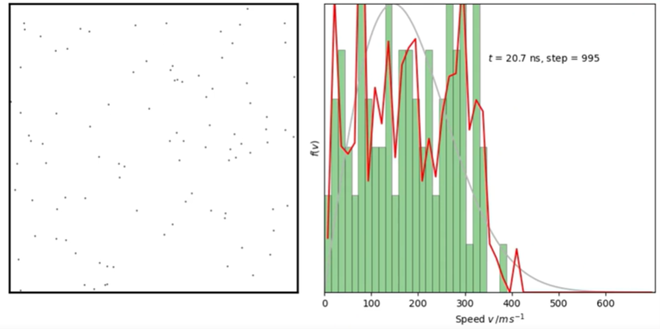
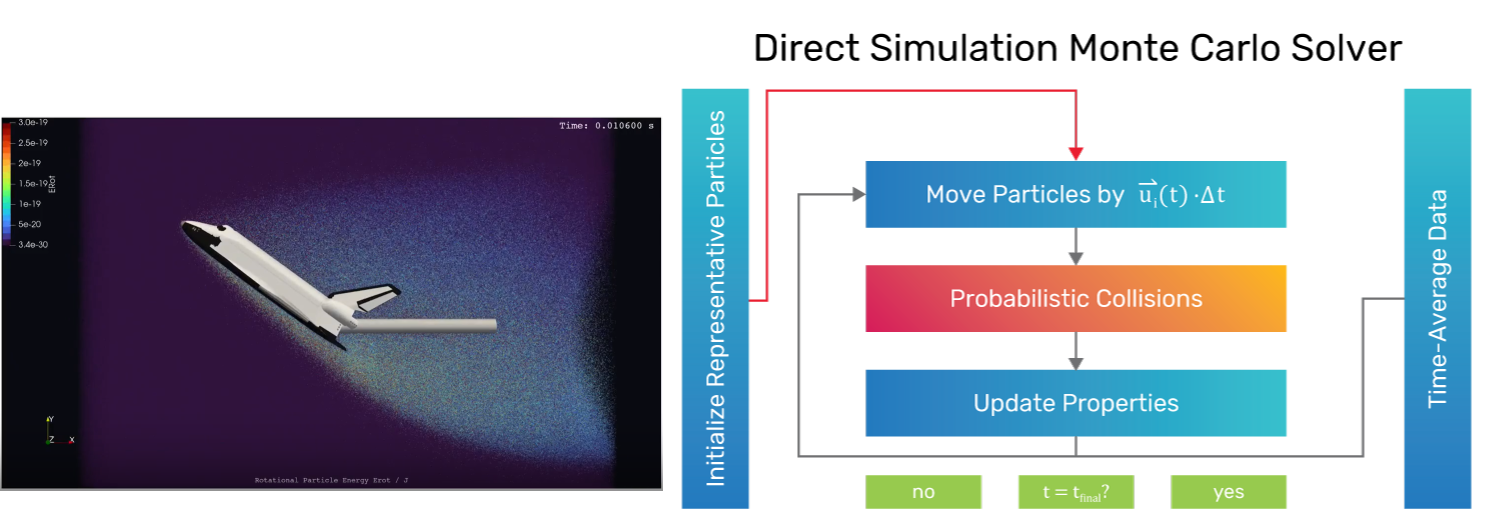
In Figure 4, a rarified fluid is observed on the left side, while on the right side, there is a distribution of the Maxwell-Boltzmann curve. Due to the low pressure or density, there are not enough particles to create the green histograms that follow the trajectory of the distribution curve. To address this, a representative solution is initialized in the domain on the left, and then the particles are moved each time step, based on the given initial conditions such as velocity and reentry angle. The probabilistic collisions are then run, which is the actual Monte Carlo step, and the particle properties are updated in each time step. In each cell, there is a certain number of particles with specific velocity vectors, which are summed up and averaged over each cell to derive the microscopic properties like temperature and velocity in each cell.
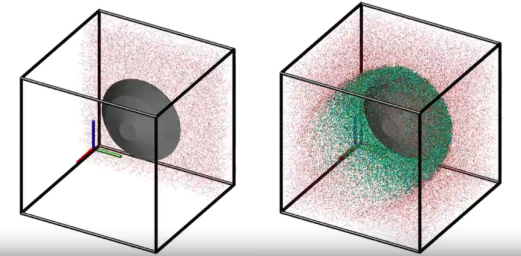
In Figure 5, a spaceship reentry simulation was run, and a bow shock formation was observed in front of the vehicle. The rotational energy of the particles was also analyzed and found to increase significantly after they reached the stagnation point in front of the vehicle. The solver used for the DSMC calculations was an open-source solver developed by NASA called Spartan, which uses a cartesian grid approach for maximum mesh quality and minimum number of cells. The input geometry is provided as an STL file, and a Boolean operation is used to cut the cartesian grid by the STL file. Figure 6 shows particles traveling through the domain and hitting the Viking reentry capsule, which drastically increases the temperature as soon as they hit the bow shock, denoted in green.
Modeling the Atmospheric Chemistry
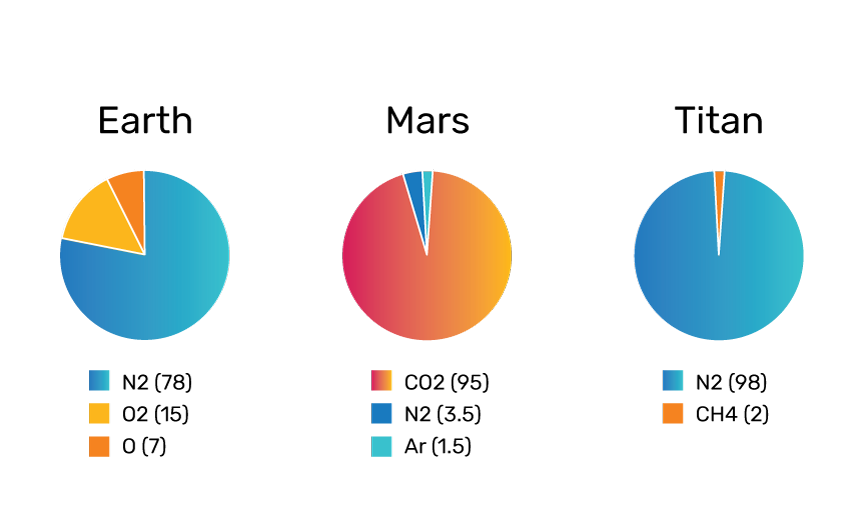
The specific composition of the planet’s atmosphere is important when considering the atmospheric chemistry on Mars. Mars’s atmosphere comprises approximately 95% carbon dioxide, 3.5% molecular nitrogen, and trace amounts of oxygen. Depending on the sun's activity, different compositions must be used for each re-entry body, significantly impacting dissociation recombination effects and surface gas interaction. A quantum kinetic approach known as QK is utilized to model these effects in the free molecular regime. This approach is based on the microscopic properties of the particles, as opposed to the CFD approach, which updates the chemistry in each time step based on the microscopic properties of the fluid. For CFD simulation, the Arrhenius equation is commonly used. While in QK, different equations are used to account for variables such as each particle's impact angle.
The gas (while in the continuous regime) becomes denser when the vehicle enters a lower atmospheric altitude. The gas is still rarified, but there are enough particles to follow the Maxwell-Boltzmann distribution in the continuous regime. A time average of the entire time represented in the histogram confirms that the data follows the Maxwell-Boltzmann distribution. Physically, this distribution is satisfied due to the small mean free path of the gas molecules. Therefore, the gas behaves as a continuum, and we can apply the Navier-Stokes equations.
Continuous Regime
The concept behind this approach is to calculate the momentum, energy, and mass, like traditional CFD codes, but with some adjustments. On the left side, the characteristic temperature in each cell is depicted by considering the molecular-level behavior. These particles have various energy modes, such as translational, rotational, or radiation energy. They become highly stimulated when they collide with the vehicle surface or pass through the bow shock. Chemical reactions that may lead to dissociation are also considered.
Meshing with Fidelity Pointwise
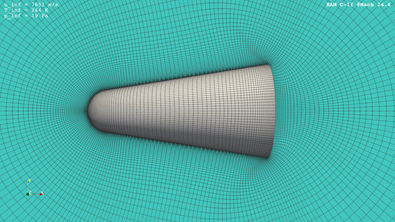
The validation study for the below case uses an unstructured mesh generated in Cadence Fidelity Pointwise. The extruded boundary layer utilizes an advancing front technique on the vehicle's surface, which is then extruded towards the boundary layer. In the far-field, voxel-based meshing is used. Thus, the cartesian grid expands through these transition layers with the tetrahedra towards smaller or larger cartesian blocks, depending on the mesh generation location in the domain.
Case Study: RAM C-II
One of the first and most sophisticated communication blackout research probes, RAM C-11 was launched in 1970 [1]. Many data were acquired specifically for the plasma field (ionized species) to study the effects of the plasma produced within and in close proximity to the bow shock on the vehicle, particularly radio attenuation measurements (RAM). The schematic and trajectory of the RAM C-II capsule are highlighted in Figures 9 and 10.
In Figure 11, the contours of temperature illustrate how the temperature rises to 5,000 K in front of the vehicle, where the dissociation and ionization take place. This is responsible for the communication blackout, as ions and electrons are produced (see a mass fraction of electrons in the figure) and electromagnetic waves cannot travel through the plasma and are absorbed.
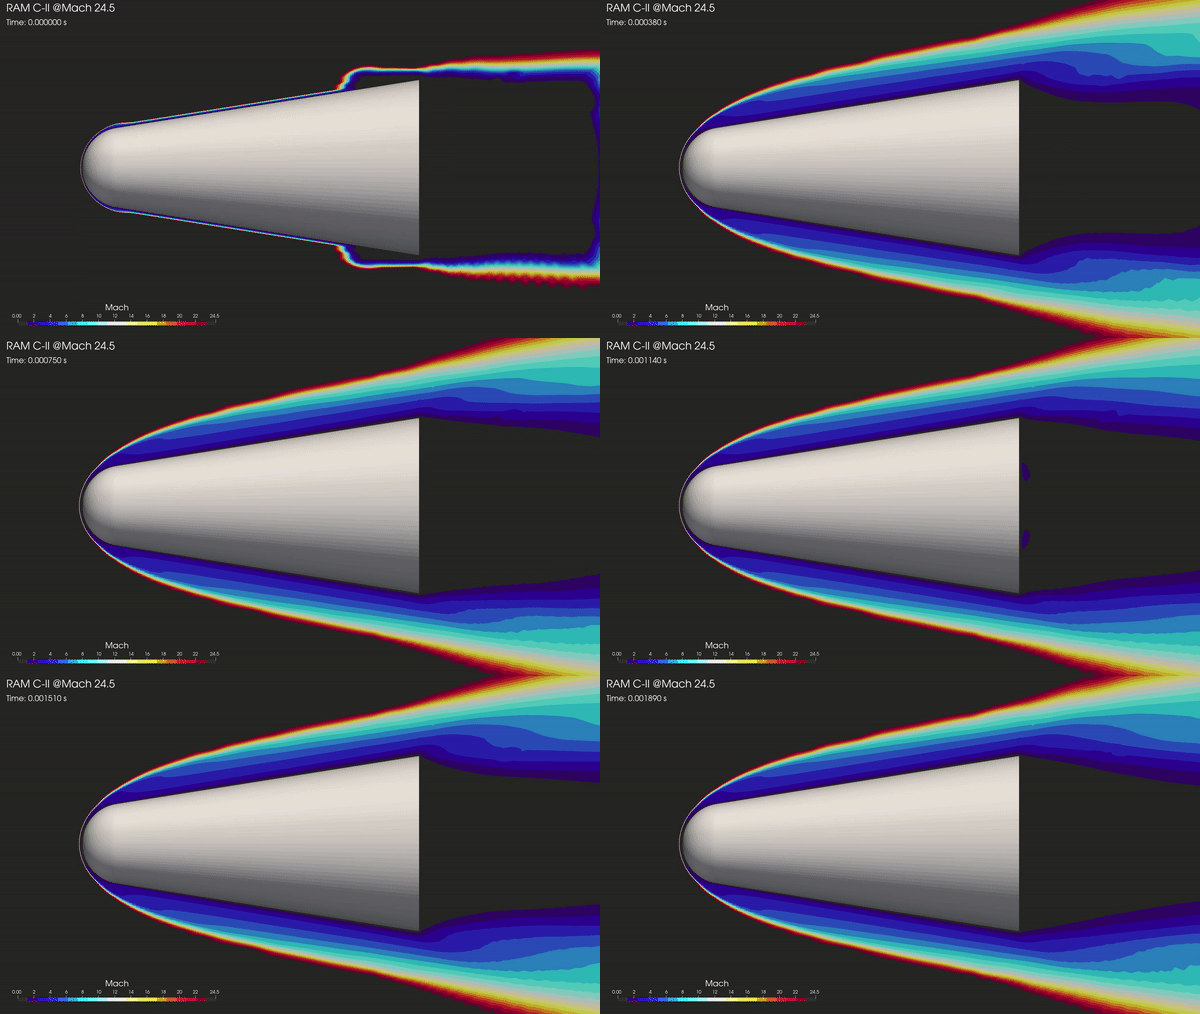
In Figure 12, the Mach number contours illustrate the sharp shock in front and around the vehicle.
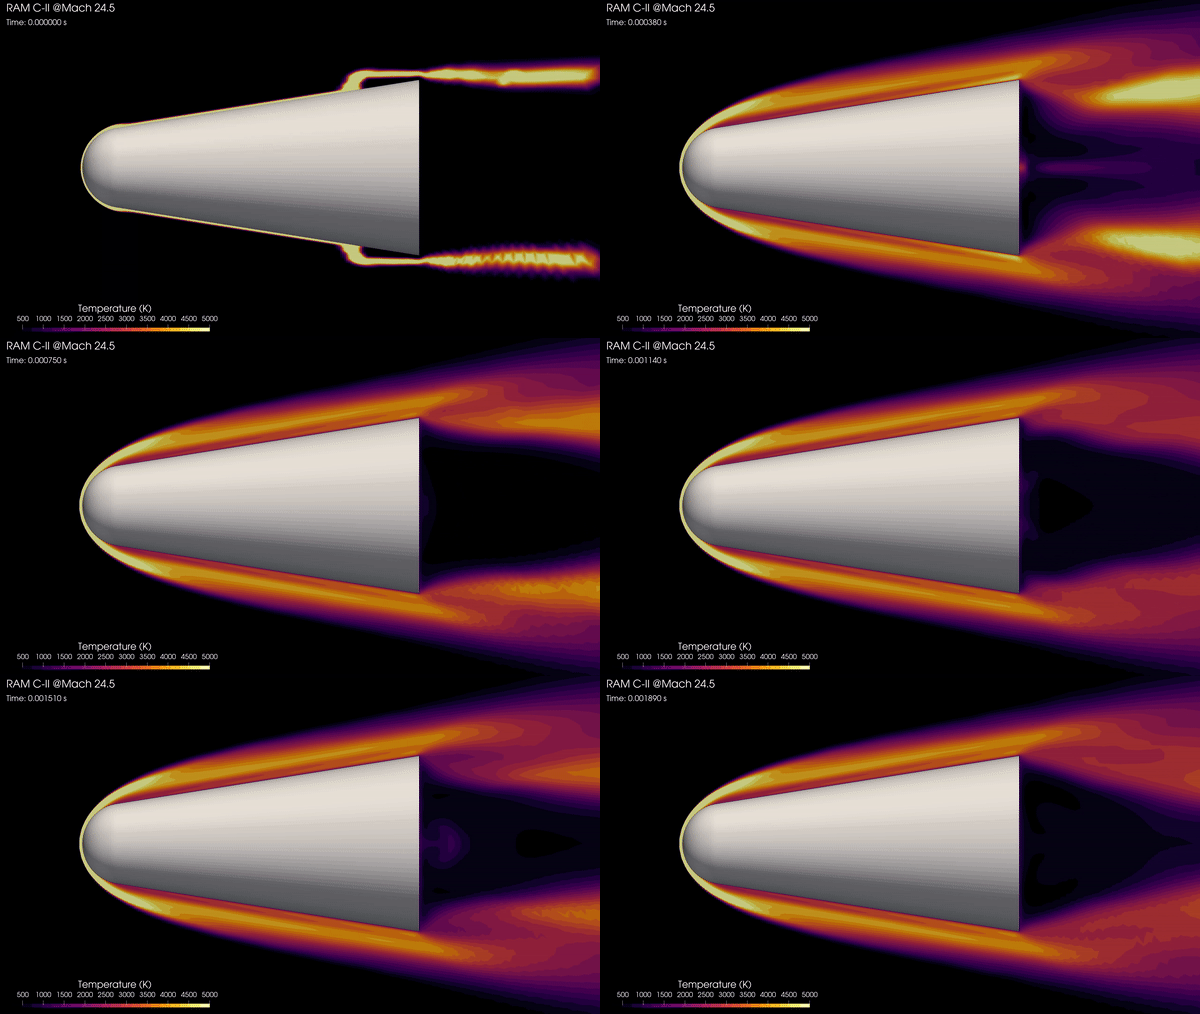
In Figure 13, the contours of temperature illustrate how the temperature rises to 5,000 K in front of the vehicle, where the dissociation and ionization take place. This is responsible for the communication blackout, as ions and electrons are produced (see a mass fraction of electrons in the figure below) and electromagnetic waves cannot travel through the plasma and are absorbed.
Figure 14 illustrates the dissociation of O2 into atomic oxygen due to the extreme temperature in the bow shock.
Case Study: Viking
The Viking 1 Lander, launched in 1976, is an ideal example for hypersonic reentry simulations. With its high angle of attack reentry profile, it provides valuable insight for future reentry missions. During reentry, the Viking capsule experienced extreme conditions, including low temperatures and pressure of 144 Kelvin and 5Pa. The capsule enters at an angle of 11 degrees, at an altitude of 44km, and speeds of 23.1 Mach. The image on the left showcases the fully assembled Viking capsule, measuring 3.5m in diameter. The image on the right displays a cut section of the capsule, where the free stream approaches the capsule at the reentry angle.
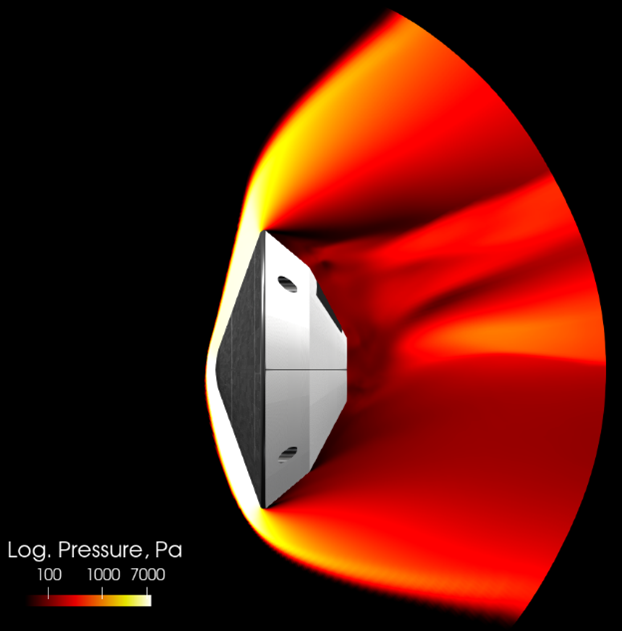
In Figure 16, the contours of pressure around the spacecraft illustrate how the bow shock in front of the vehicle heats the fluid with a rarefied wake near the rear side of the spacecraft. Then, the structure of so-called re-compression shocks behind the spacecraft occurs and further rarefies the downstream flow.
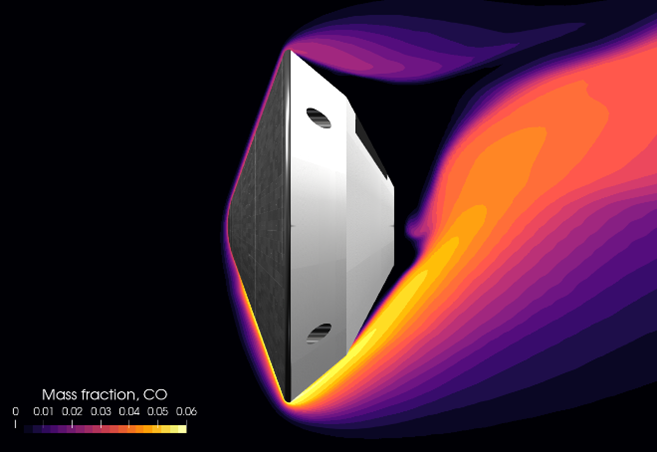
In Figure 17, the contours of carbon dioxide (CO2) mass fraction in a pseudo-steady state, illustrating how CO2 dissociates into carbon monoxide behind the bow shock in front of the vehicle.
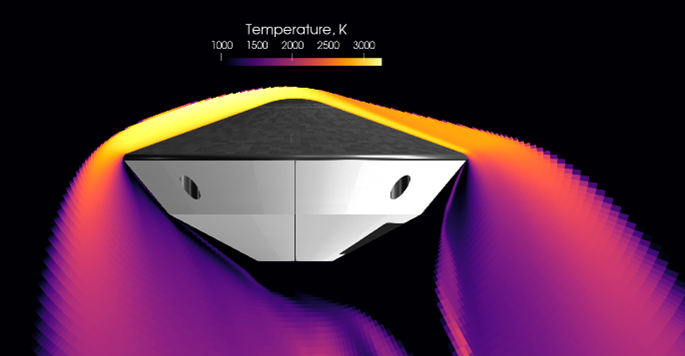
Figure 18. illustrates the contours of temperature in steady state to show how fluid compression converts its kinetic energy into heat and static pressure. Notice that the dynamic pressure, hence the fluid, has a lot of energy from the vehicle’s very large free stream velocity, which dissipates into the different energy modes (translational, vibrational, and rotational).
References
- Jones, W. and Cross, A., "Electrostatic-probe measurements of plasma parameters for two reentry flight experiments at 25000 feet per second," NASA Technical Report TN D-6617, 1972
- Schettino, A., Battisat, F., Cristofolini, A., Borghi, C., Passaro, A., and Baccarella, D., "MHD blunt body test design in high enthalpy plasma air flow,” 16th AIAA/DLR/DGLR International Space Planes and Hypersonic Systems and Technologies Conference, 2009
- Allegre, J., Bisch, D., and Lengrand, J.C., "Experimental Rarefied Heat Transfer at Hypersonic Conditions over 70-Degree Blunted Cone," Journal of Spacecraft and Rockets, Vol. 34, No. 6, 1997, pp. 724-728
- Legge, H., “Experiments on a 70 degree Blunted Cone in Rarefied Hypersonic Wind Tunnel Flow,” 28th AIAA Thermophysics Conference, San Diego, AIAA 95-2140, 1995
- Ivey, C., Danehy, P.l., Bathel, B., Dyakonov, A., Inman, J., and Jones, S., "Comparison of PLIF and CFD Results for the Orion CEV RCS Jets,” doi:10.2514/6.2011-713, 2011
- Longo, J.M.A., Hannemann, K., and Hannemann, V., “The challenge of modelling high speed flows,” ISBN 978-3-901608-32-2, 2007
- Padilla, J. and Boyd, I., "Assessment of Gas–Surface Interaction Models for Computation of Rarefied Hypersonic Flow," Journal of Thermophysics, Vol. 23, No. 1, 2009

![Left: Schematic of RAM C-II capsule [1], Right: Section cut [2] Left: Schematic of RAM C-II capsule [1], Right: Section cut [2]](/content/dam/cadence-www/global/en_US/images/resources/technical-brief/simulating-reentry-trajectories-tb-fig-9.png)
![Trajectory of the RAM C-II capsule [1] Trajectory of the RAM C-II capsule [1]](/content/dam/cadence-www/global/en_US/images/resources/technical-brief/simulating-reentry-trajectories-tb-fig-10.jpg)
